In Brazil, 55.5% of the population identifies as Black. Among people with disabilities, the share is almost the same: 54% are Black. Disability is also more prevalent among Black (preta) people (8.6%) than among white people (7.1%).
These numbers are no coincidence. Structural racism means less sanitation, less preventive healthcare and greater exposure to violence and workplace accidents. All of this raises the risk of living with a disability.
What comes next is a sequence of closing doors. The data below show three of them.
Health: no insurance, no rehabilitation
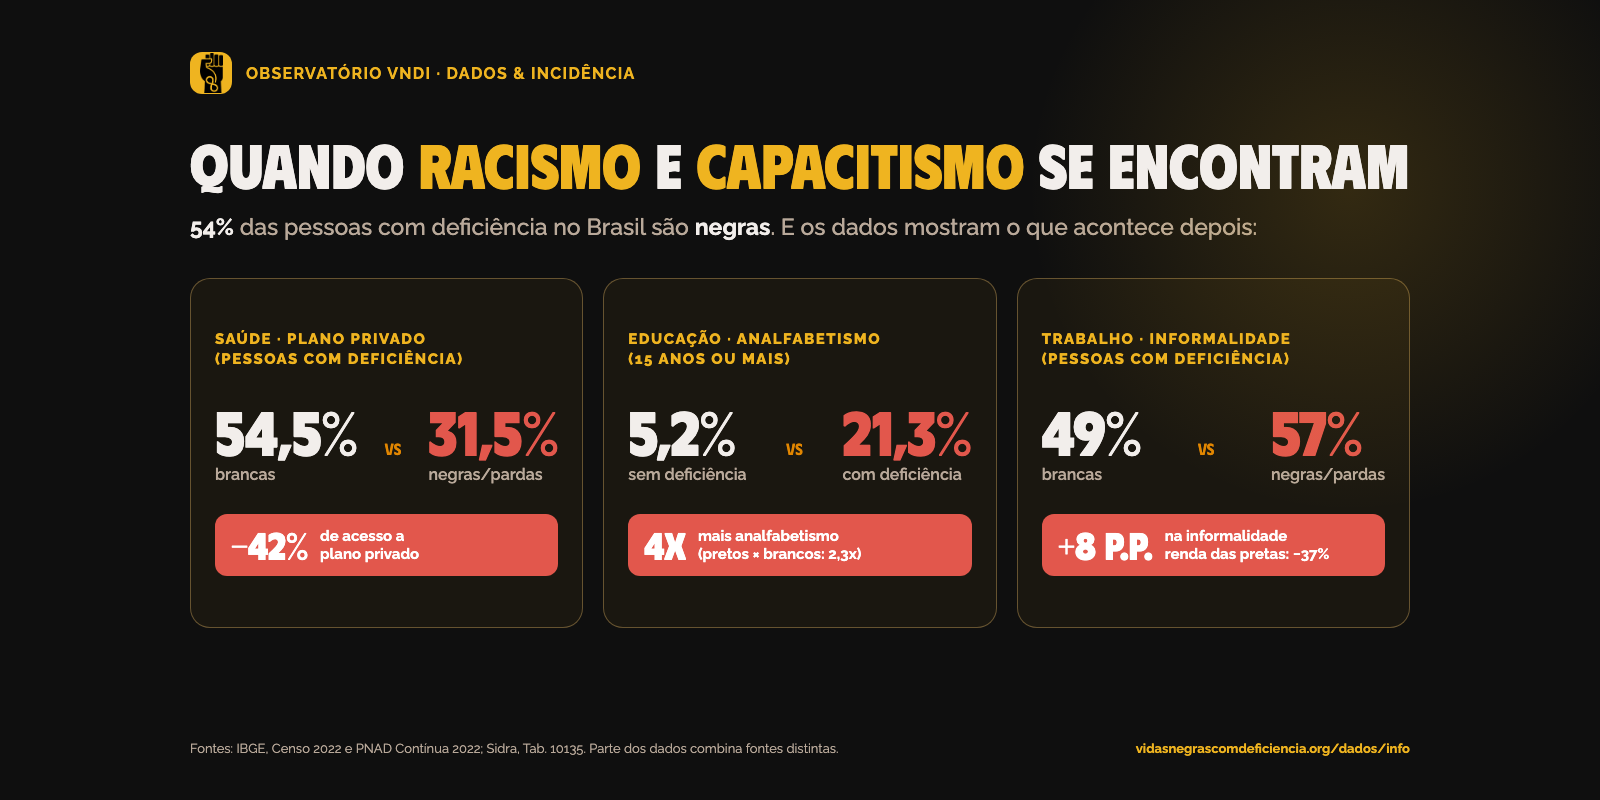
Among people with disabilities, 54.5% of white people have private health insurance. Among Black and brown (parda) people, it is 31.5%. That is 42% less access.
Those without insurance rely almost entirely on the public health system (SUS), which is essential but underfunded given the demand for rehabilitation, therapies and assistive technology. The result shows up in the queue: 24% of white people with disabilities access rehabilitation services, compared with 20.4% of Black and brown people.
Education: a path marked twice
The illiteracy rate among people with disabilities (aged 15 and over) is 21.3%. Among people without disabilities, it is 5.2%, four times lower.
Racism shows up along the same path. Among Black (preta) people, illiteracy is 10.1%, against 4.3% among white people. That is 2.3 times higher.
Researchers point out that Black children with disabilities face both forms of discrimination at once: inappropriate referrals, low teacher expectations and a lack of accessibility in public schools, where most of them study.
Work and income: precarious conditions
Among people with disabilities, 57% of Black and brown people work informally, compared with 49% of white people. Without a formal contract, they have no social protection and less stability.
Income shows the accumulated effect: Black (preta) people earn, on average, R$ 1,485 from their main job, and white people R$ 2,358. That is 37% less, considering the whole population, with and without disabilities.
What the numbers do not show
Official Brazilian data still treat race and disability as separate categories. That is why much of the statistics above combine different sources to approximate the reality of those who live both conditions. Only a few cuts, such as health insurance, rehabilitation and informal work, cross race and disability directly. The sources and methodological note are in the dashboard.
This gap has consequences: what is not counted does not enter public policy. Black people with disabilities remain invisible precisely where decisions are made.
That is why the VNDI Observatory exists: to produce the missing data and to train Black leaders with disabilities who will use it.
Sources: IBGE (2022 Census and PNAD Contínua – People with Disabilities 2022; Sidra, Table 10135); Ministry of Racial Equality; Jornal da USP (2023). Accessed in September 2026.